The Essential Guide to A/B Testing
Take the guesswork out of conversion optimization.
What is A/B Testing?
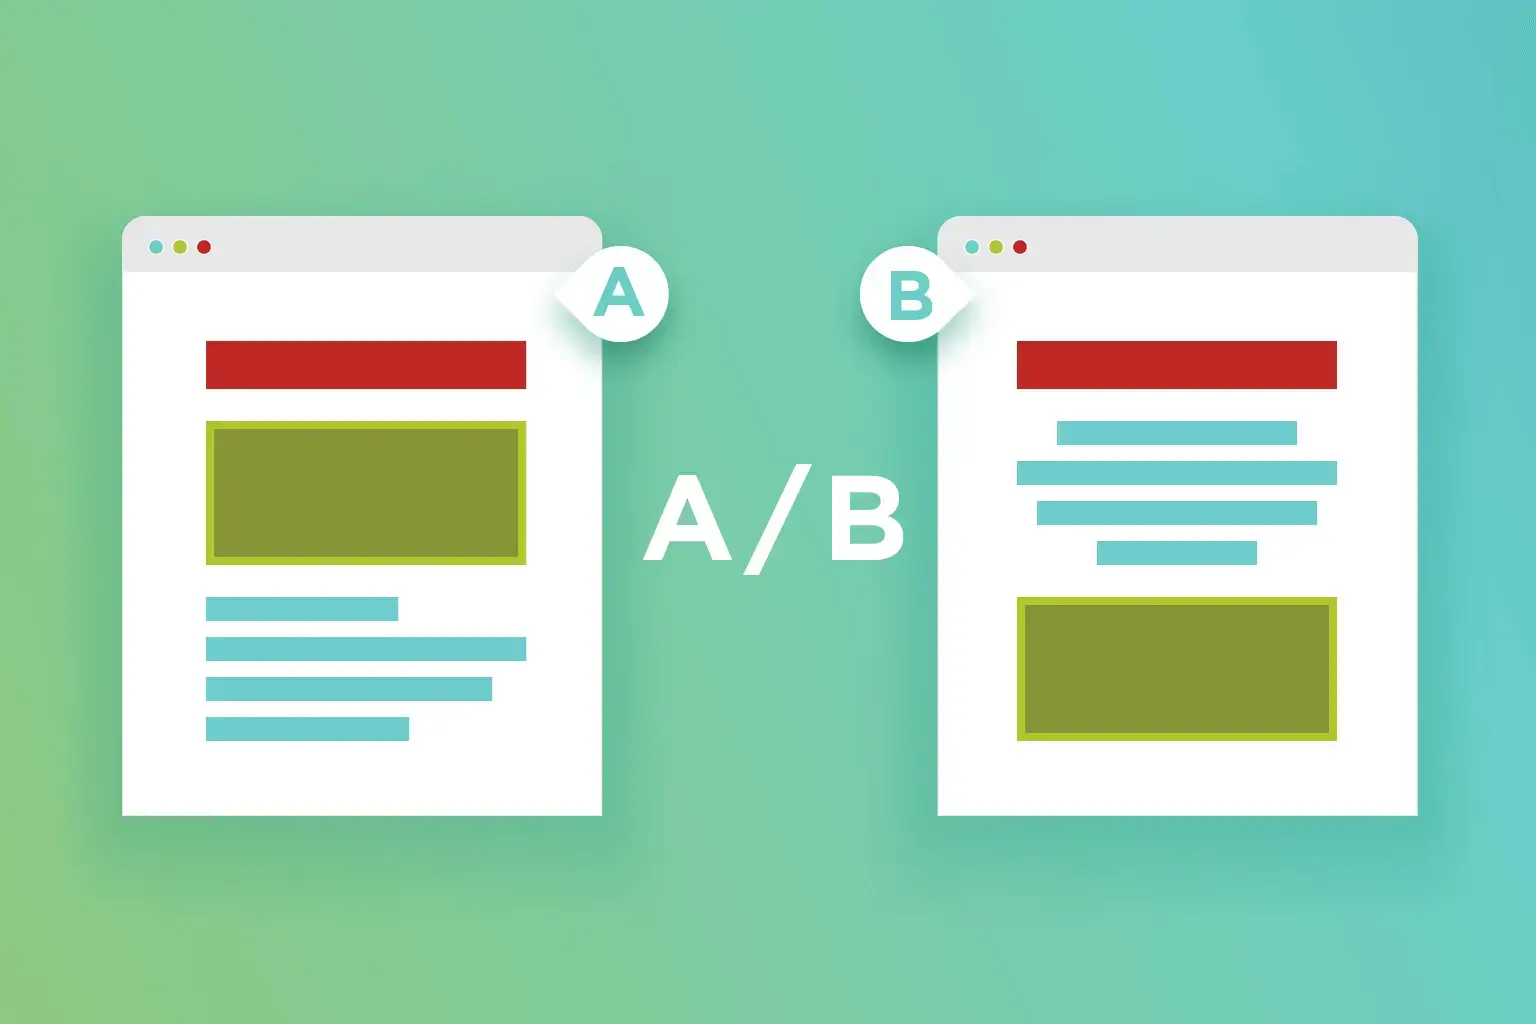
A/B testing is a method comparing two versions of a web page and see which one performs better. It does so by serving two or more variants of a web page to visitors at random and comparing the number of goal completions for each, allowing you to optimize the conversion rates for your page.
Why A/B Test?
By serving all variants in the A/B test concurrently, variables that would potentially affect conversions such as the time of day, day of the week, weekends, weekdays, and holidays are all taken out of the equation. This gives you the most accurate and fair comparison between each of your page variants.
By taking out the guesswork with conversion optimization, you can start making accurate, data-based decisions for your business.
Before you begin, make sure you have Google Analytics added to your website.
Google Analytics will be providing the A/B testing and conversion tracking tools that you'll need to run a complete test.
Learn how to set up Google Analytics
- 1Decide What to Test
A/B testing is quite flexible in that there's really no restriction on what you can test -- you can even A/B test two entirely different looking pages.
But if you're looking for the best results, you should only A/B test one thing at a time. Testing one thing at a time gives you a clear answer as to whether or not that particular change had a positive impact to your conversion rate. If you test multiple things at the same time, you won't know which changes are positive and which ones are negative.
If you're looking for the best results, you should only A/B test one thing at a time.
Testing one thing at a time gives you a clear answer as to whether or not that particular change had a positive impact to your conversion rate.
If you test multiple things at the same time, you won't know which changes are positive and which ones are negative.
Here are a few things that can impact your conversion rate and are worth testing:
Changing your primary selling proposition or page headline
Changing your hero image or main photo
Changing your hero banner content
Changing your primary call to action button
Changing your lead generation form
- 2Create Your Page Variant
The easiest way to start is to clone the page that you want to A/B test.
To clone a page:
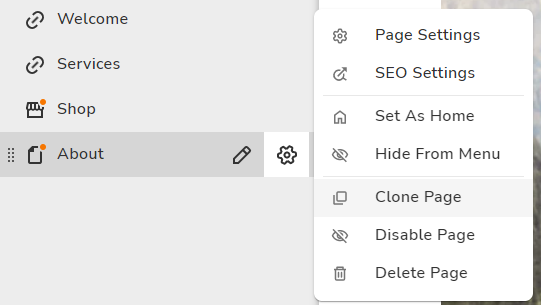
In the Site Builder, click on Site Pages from the left sidebar.

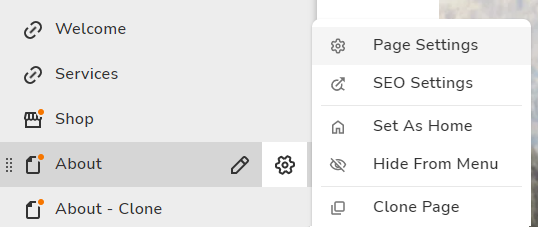
Put your mouse cursor over page that you want to clone from and click on the gear icon to the right of the page name.
Click Clone Page that's at the bottom-left.

Give your cloned page a name and click Done.
Google Analytics will help us handle the A/B test.
This is great because all your web statistics and A/B testing results will be stored in one place.
To create your A/B test:
Log into your Google Analytics account.
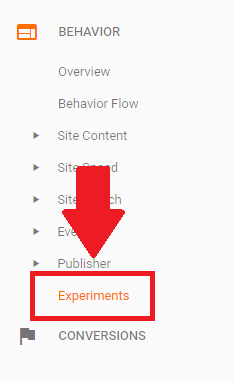
In the left menu, click Behavior and then Experiments.
Click the Create Experiment button.
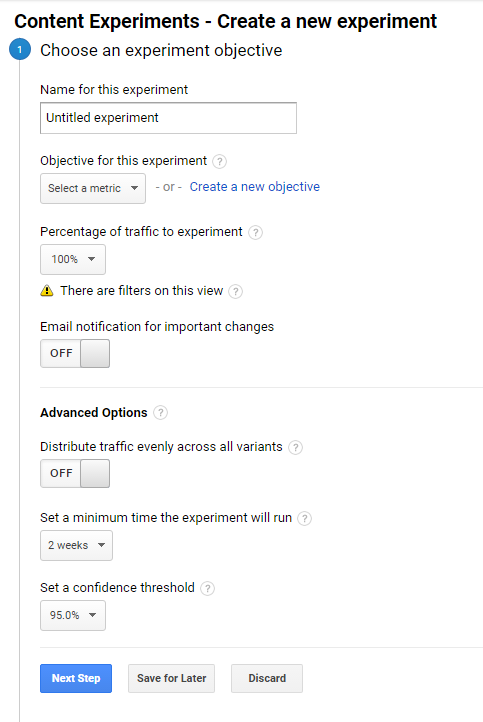
Here, you'll be taken through a wizard on setting up how you would like to run your A/B test. You should see these steps.
- 1Choose an Experiment Objective
Name for this experiment
Just give your experiment a name. This name will show on on your list of experiments in Google Analytics.
Objective for this experiment
This is what Google Analytics will track as a conversion for this A/B test. You can select from any of the goals you have already set up in Google Analytics, or you can create one on the spot.
Learn how to set up goals in Google Analytics
Percentage of traffic to experiment
This is the amount of web traffic that you want to use for your A/B test. Unless you're running a high risk A/B test, we recommend you set this at 100% since will give you the most data and the fastest results.

Percentage of traffic to experiment
If you have this setting ON, Google Analytics will distribute your traffic evenly to all variants. This places your original page and variant pages on equal footing, and will give you the most objective results.
If you have this setting OFF, Google Analytics will distribute traffic according to the performance of each page -- the pages that are performing well will receive more traffic, whereas the pages that are performing poorly will receive less. The results won't be as pure as distributing traffic evenly, but you can come to a conclusion much quicker.
Set a minimum time the experiment will run
This is the minimum duration that your A/B test will run before Google Analytics declares a winner. This means that even if your A/B test reaches a statistically significant result, Google Analytics won't declare a winner until the minimum time has passed. Setting a longer time is recommended if you want the most accurate and confident results.
Set a confidence threshold
This is the confidence threshold that must be reached before Google Analytics will declare a winner.
A high confidence level means that if you were to repeat the same A/B test many many times, you are likely to get the same results. Setting a higher confidence threshold means that it will take longer for Google Analytics to declare a winner, but the result is more likely to be accurate. Typically, reaching 95% confidence is a very strong indicator that the results are accurate.
Once you're done, click Next Step.
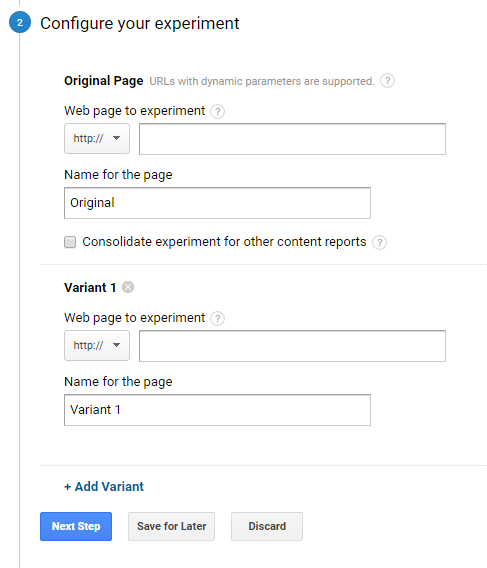
- 2Configure Your Experiment
This is where you specify which page will be the original page -- the baseline page that you will be comparing your variants against -- and which pages will be the variants.
Simply copy and paste the web addresses (URLs) for each page into the corresponding fields.
If you need to add more than one variant, you can click + Add Variant to add more entries.
Once you're done, click Next Step.

- 3Setting Up Your Experiment Code
Here, you can just choose Manually Insert The Code.
You will be given the experiment code for this A/B test. You will need to add this code to your Original Page -- the page you're pitting your Variants against -- by doing the following:
In the Site Builder, click on Site Pages from the left sidebar.
Put your mouse cursor over your Original Page and click on the gear icon to the right of the page name.

Click Custom Code.
Paste the experiment code that Google Analytics gave you into the first box (the one for header code).

Click Save.
- 4Review and start
Google will validate your pages to see if the experiment and tracking codes have been added properly.
If everything is OK, you can click Start Experiment to run your A/B test.
Google Analytics will update your A/B testing statistics in batches throughout the day. You can look at the test results by clicking Behavior and then Experiments from the left menu.
For each test, Google Analytics will give you the following data:
Experiment Sessions
This is the number of page views that each page received so far.
Conversions
This is the number conversions that each page has received so far.

Conversion Rate
This is the conversion rate of each page calculated based on the number of conversions divided by the number of experiment sessions.
Compare to Original
This number represents how much better or worse each variant is compared to the original in terms of conversion rates. A positive number means that the variant has outperformed the original, whereas a negative number means the variant was worse than the original.
Probability of Outperforming Original
This number represents likely the variant will perform better than the original through repeated tests. A high probability means that the result is pretty solid and the variant should outperform the original even if you repeat the test numerous times. A low probability means that it's unlikely the variant can outperform the original.
We recommend that you hold off on analyzing the results of your A/B test until you have had enough experiment sessions or your variants have reached a high probability of outperforming original score, because this is when the numbers become statistically significant.
Once you've analyzed the results and you are confident that the variant will consistently outperform the original, you can replace the original page with the variant page in the site builder.
